
Risk is forecastable. Direction is not.
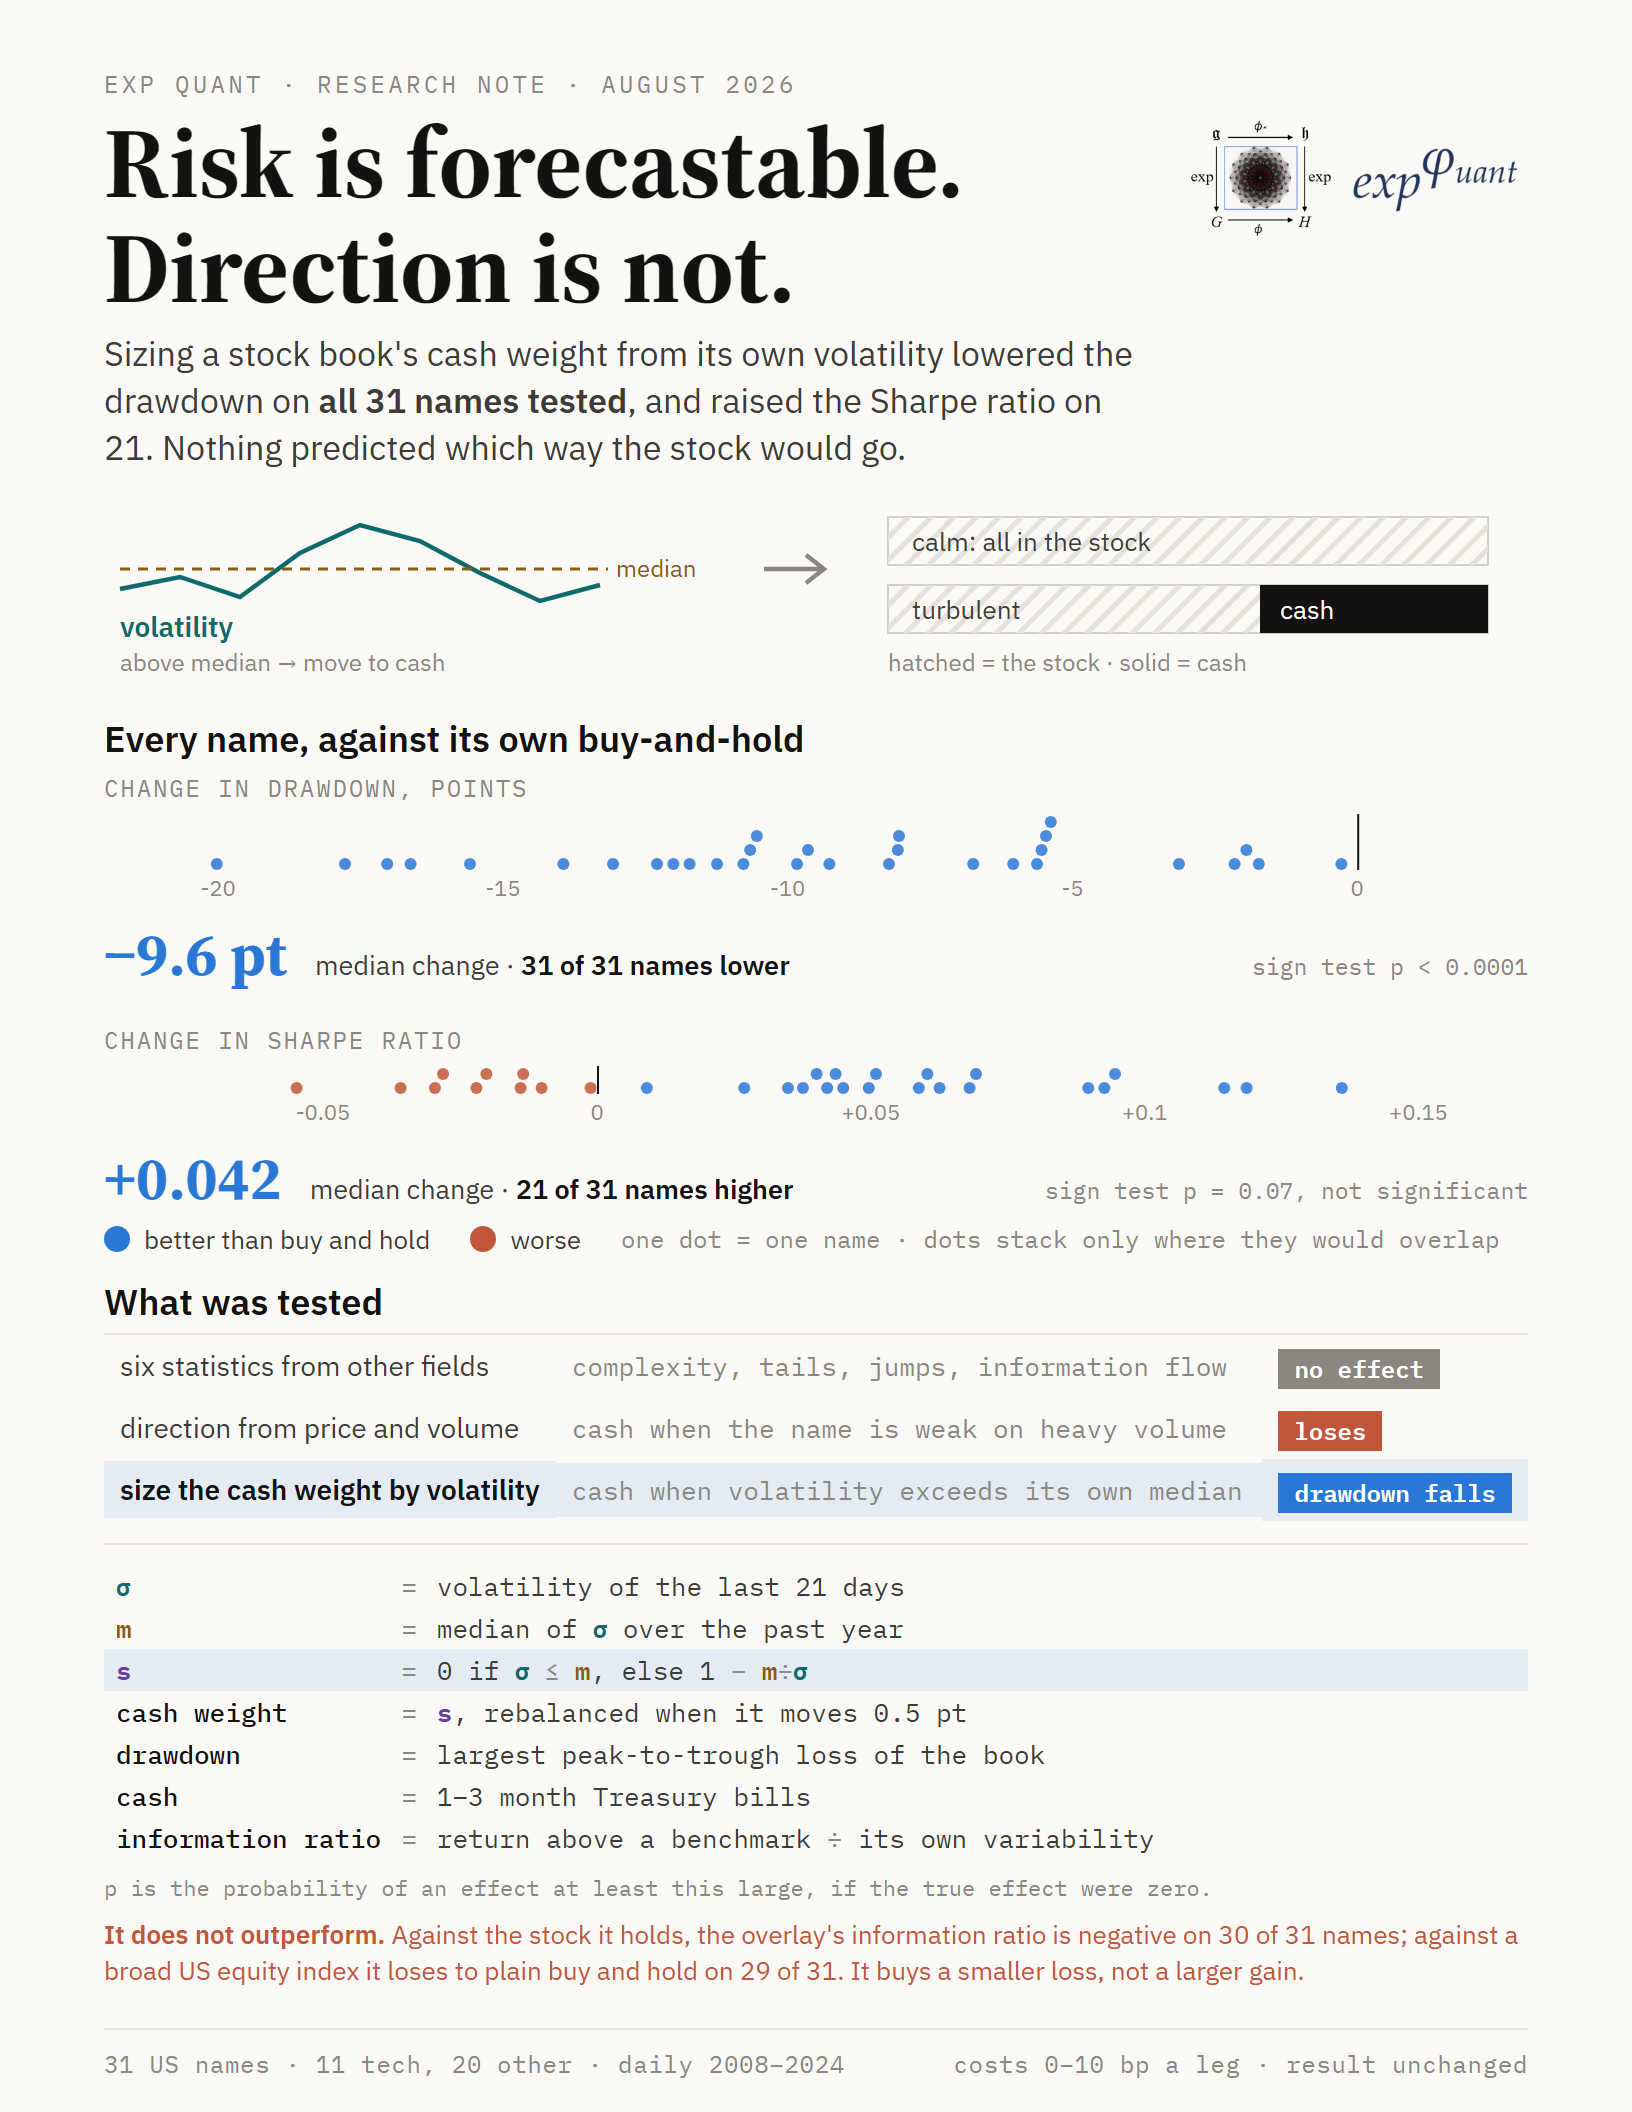
We moved part of a single-stock book into Treasury bills when the stock became turbulent. The largest loss became smaller on every one of the 31 names we tested. Nothing we tried told us which way the stock would go next.
The question
A book that holds one stock can try to forecast two different things. The first is how much the stock will move. The second is which way it will move. These are not the same problem, and they are not equally difficult.
We tested three approaches on the same panel of names. Two of them forecast direction. One of them does not.
What we tested
The first two approaches ask which way the stock will go. Neither of them helped. The third approach does not ask which way. It asks how much, and it works because volatility is persistent: a stock that is turbulent this month tends to stay turbulent into the next one. That persistence is what makes the size of a move forecastable while its direction is not. That is the claim in the title, and it is the only claim we make.
How the rule works
The rule needs three quantities. The first is the volatility of the last 21 days. The second is the median of that volatility over the past year. The third is the cash weight. The cash weight is zero while volatility stays at or below the median. Above the median, the cash weight is one minus the median divided by the volatility. The book rebalances when that weight moves by 0.5 points. Cash is 1 to 3 month Treasury bills.
At the median volatility the book holds no cash. At twice the median it holds half of the book in cash. Each name is measured against its own median, so the rule has no fitted constant. This is why it moves from one name to the next without calibration.
How we kept the test honest
A rule that holds cash lowers risk whether or not it knows anything. The test is therefore not whether the risk fell. The headline benchmark is buy and hold of the same name, at full weight, so each name is scored against itself. This is the strict comparison, and it is the one that decides the question: it removes any credit the rule might take for the market going up. We also score every name against SPY total return, which is the looser test, and we report both. All series are adjusted for splits and dividends. The count uses a two-sided sign test. In the figures, p is the probability of an effect at least this large, if the true effect were zero.
We charged costs from 0 to 10 basis points a leg. The result does not change across that range, because the rule trades on changes in the volatility regime and not on every day.
One limit applies to both counts. The 31 names are all US equities in one market, so they do not move independently. The counts therefore overstate the strength of the evidence.
What came back
The drawdown result is the finding, and it holds on every name in the panel. The return result is weaker. A sign test puts the Sharpe count at p = 0.07, which does not clear the usual bar.
Where this leaves us
This result suits one kind of mandate and not another. A mandate that asks for the same exposure at a lower worst loss is met, and it is met with high consistency across names and periods. A mandate that asks for a higher return than the stock is not met, and no version of this rule will meet it.
We have not deployed this rule. It has not traded live capital, and it has not run in paper trading. This note reports a study of a proposal, and we publish it at that stage.