
Start-date luck, engineered out
A backtest starts on the date you choose for it. Live capital starts on the date it starts. We measured how much that difference decides, across 29 quarterly start dates.
The question
A backtest that begins in 2019 tells you about one start date. It does not tell you what happens to a client who starts in a different quarter. That client sees the first six months, and the first six months are what decides whether the mandate survives.
So we asked a plain question. If you deploy this engine on an arbitrary quarter and hold it for six months, how far behind the market can it fall, and does it get back?
How we kept the test honest
We did not cut one long equity curve into pieces. Each start date is a separate run, and each run begins with no positions, in the same way a new deployment does. Both engines ran from every one of the 29 dates. The benchmark is SPY total return, bought on the same date as the deployment, so the comparison starts level. Every figure below is measured against it.
Both engines reproduce exactly when we run them again. This matters for a study of this shape, because a difference between two engines is only evidence if neither engine moves when nothing changes.
One limit is built into the design. The window is six months, so a recovery that takes longer counts here as behind. About one recovery in seven takes longer than six months. The count of dates that ended behind is therefore a strict reading and not a generous one.
What came back
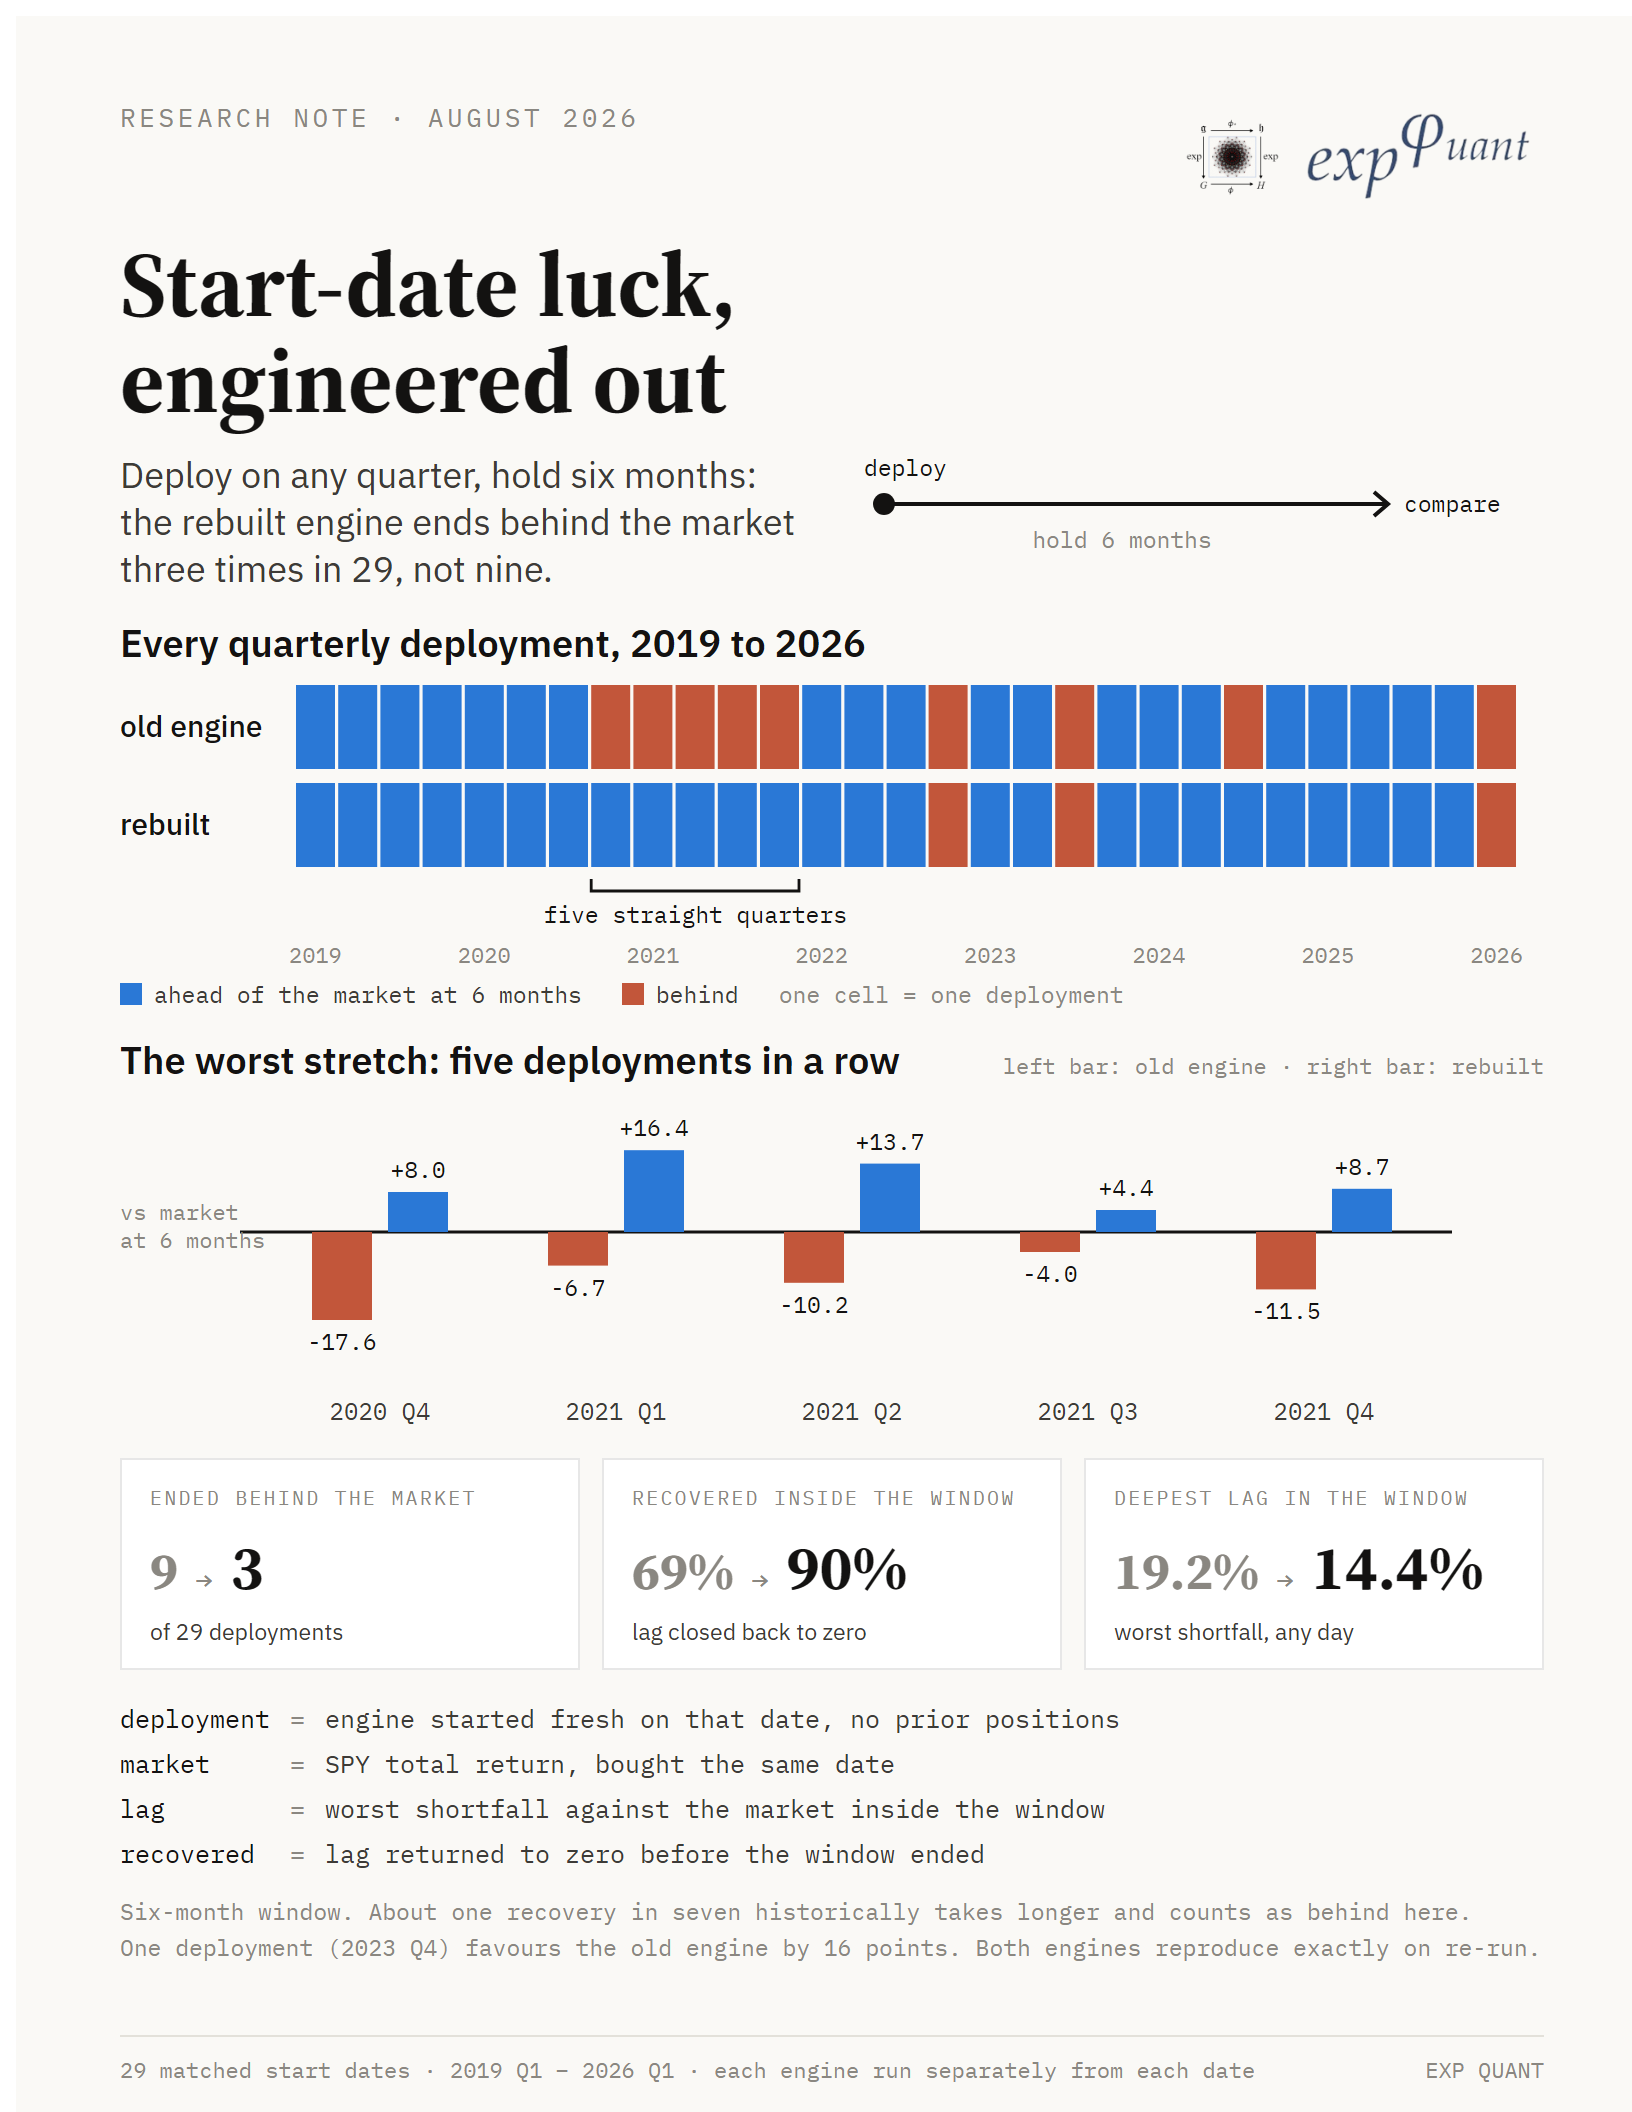
The clearest part of the result is not in the totals. It is one stretch of the calendar. Five consecutive quarters, from 2020 Q4 to 2021 Q4, are behind the market for the old engine on every one of the five. The same five dates are ahead of the market for the rebuilt engine on every one of the five. That is a full year of start dates where the old entry was structurally poor, and it is the pattern the rebuild was meant to remove.
We report the exception with the rest. One deployment, 2023 Q4, favours the old engine by 16 points. A study of 29 dates that found no exceptions would be a study to distrust.
Where this leaves us
Two things improved together. Fewer start dates end behind the market, and more of the shortfalls that do occur close before the window ends. Both matter to a client, and the second is easy to overlook: a shortfall that recovers inside the window is a different experience from one that does not.
Two claims need to stay separate. The rebuild removed a specific failure: five consecutive start dates where the entry itself was poor, and where not one of the five recovered inside the window. That pattern is gone. It did not remove the ordinary variation between one quarter and the next. Three dates in 29 still end behind the market, and one of those still favours the old engine. The failure is engineered out. The variation is not.